Features required for Big Data Analysis

Some time ago businesses and institutions became aware of the importance of the storage, management and analysis of their data; which have increased commensurately, resulting in what is known today as Big Data. That enormous mass of information has always been there, but now we are more aware of everything that we can achieve through appropriate analysis methods. In any case, the increase in the amount of these figures require us to use tools that simplify a field that, in itself, is highly complicated and seemingly incomprehensible.
Some time ago, we put forward six suggestions in this blog to be successful regarding Big Data analysis. Today we shall look at the capabilities that Tableau Software can contribute to make this task easier.
Tableau for Big Data Analysis
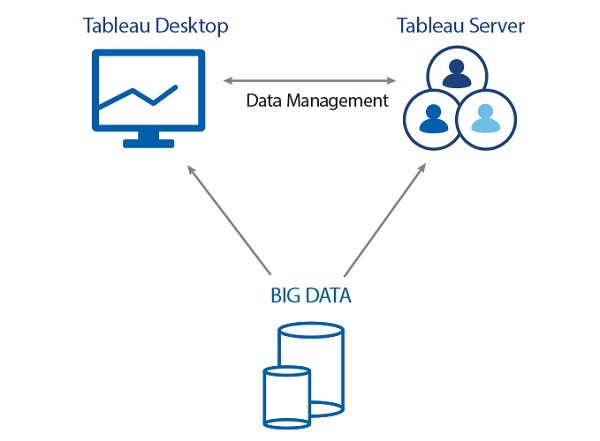
A company’s data usually come in very different formats that change over time depending on specific needs: from spreadsheets to cloud-based services, including databases, Hadoop and much more. In order to work with them, you have to be able to compile, cross-reference, prioritise, filter, create graphics… ultimately, process them to obtain fast responses if you want to have a competitive edge.
This requires connecting to the data immediately and processing them in a flexible, reliable and visual manner. All this is possible with Tableau. Queries are answered quickly, even if they include large amounts of data.
- You can connect and extract data from memory-based or live databases for instant analysis. Its fast internal analytical engine performs this task quickly and processes high volumes of data without overloading critical databases; making the most of all your computer’s memory, not only RAM, as is the case with other solutions.
- In addition, this versatility to use live or memory-based data enables us to select data to work offline and then connect again, or analyse a sample of data in order to repeat the analysis on the entire database.
- Tableau makes it possible to work with large volumes of data of all types, regardless of the size or whether they are unstructured, because it features the appropriate native connectors for this purpose. You can work with various data environments: Google Analytics, Google BigQuery, Google Cloud SQL, Amazon RedShift, Vertica, SAP Hana, Azure, Microsoft Access, Excel, csv, SQL Server, Oracle, Salesforce… There is also the option of using the ODBC (Open Database Connectivity) standard for other databases.
- Tableau does not create new data silos and it leverages all the capabilities of each database thanks to the optimisation of direct connections and high-performance cubes. This ensures the correct analysis of the data and its correct visual representation.
- Information is useless unless we can interpret it. End users can work in a more visual manner and create reports using drag and drop technology, even in the case of large amounts of data, without the intervention of the IT department. In summary, end users are the major beneficiaries of Tableau self-service features, even for large volumes of data.
- Tableau is extremely interactive. It shares reports with other users, who can change them and ask questions. There are also other options, such as embedding control panels with live connections in a corporate website.
- The displays are equally powerful and include a wide range of intuitive graphical representations.
- You can connect to the data any time and any place using a device with an internet connection, via a simple web browser, or with your Tablet or mobile device.
Proof of this is that major international companies that handle large amounts of data on a daily basis use Tableau: Barclays, Deloitte, Unilever or Tesco, are some of them.
In addition, Intelligence Partner offers you the possibility of implementing Tableau in Google Cloud, which guarantees unparalleled scalability, availability and accessibility levels for your company. You can try Tableau for free. Contact us and start processing data with a great Business Intelligence tool.


