How to build a truly useful dashboard?
 Let’s skip intuitions and cut to the chase. When it comes to defining our dashboards in a way that they are useful for decision-making, we must be clear that we can only analyse aspects that we can measure. In addition, we must choose the data that will become the basis of our KPIs very carefully.
Having a good tool to design a dashboard does not solve anything if it cannot be built appropriately. At Intelligence Partner, we are convinced of the capabilities, power and simplicity of Tableau– which undoubtedly gives it its leading position in the range of dashboard solutions and Business Intelligence. However, it is a “tool” that must be used with a specific criterion and purpose.
First of all, we would like to say that one of the added values that characterizes us as distributors of this tool is precisely our total availability to help our customers make the most of it. However, we also want our clients to be self-sufficient. Therefore, we shall dedicate a few lines to this issue to get going…
The first question we must ask ourselves is this: What do we really want to analyse? In order to answer this question, we must consider two major aspects: the goals set out by the management (aligned with the company’s strategic plan) and the fields of action that are considered vital in order to achieve those goals. Once we are clear about this, will shall establish what is known as KPIs (key performance indicators), which are precisely the indicators that will tell us about the level of compliance regarding our objectives.
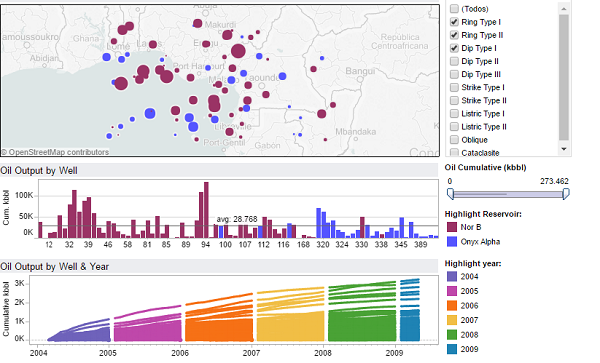
The dashboard will be the interface that will allow us to understand and interpret these indicators. With its assistance, we will be able to know the scope, the trend and deviations, identify the causes and, thus, be able to take appropriate corrective actions. In a cycle of continuous improvement that involves all the processes in the Organization. Therefore, if a dashboard is to become a truly useful tool, it must meet certain premises:
- It must be comparable over time. There is not much to explain… “time” is an essential variable, without a doubt.
- The data must be easy to quantify and understand. If only I can understand it, it won’t be much good when I share it.
- Data must be organised into concepts that make it possible to display what is working and what is not.
- It must allow a drill-down to specific data or links to other more relevant data.
- Each KPI must have a supervisor, someone in particular who can apply any appropriate action plans.


